Atlassian Analytics: Break Down Silos and Empower Your Cloud | catworkx
Atlassian Analytics: Break Down Silos and Empower Your Cloud | catworkx
Break down silos across teams or products and build interactive dashboards.
Contact
Start with pre-built templates
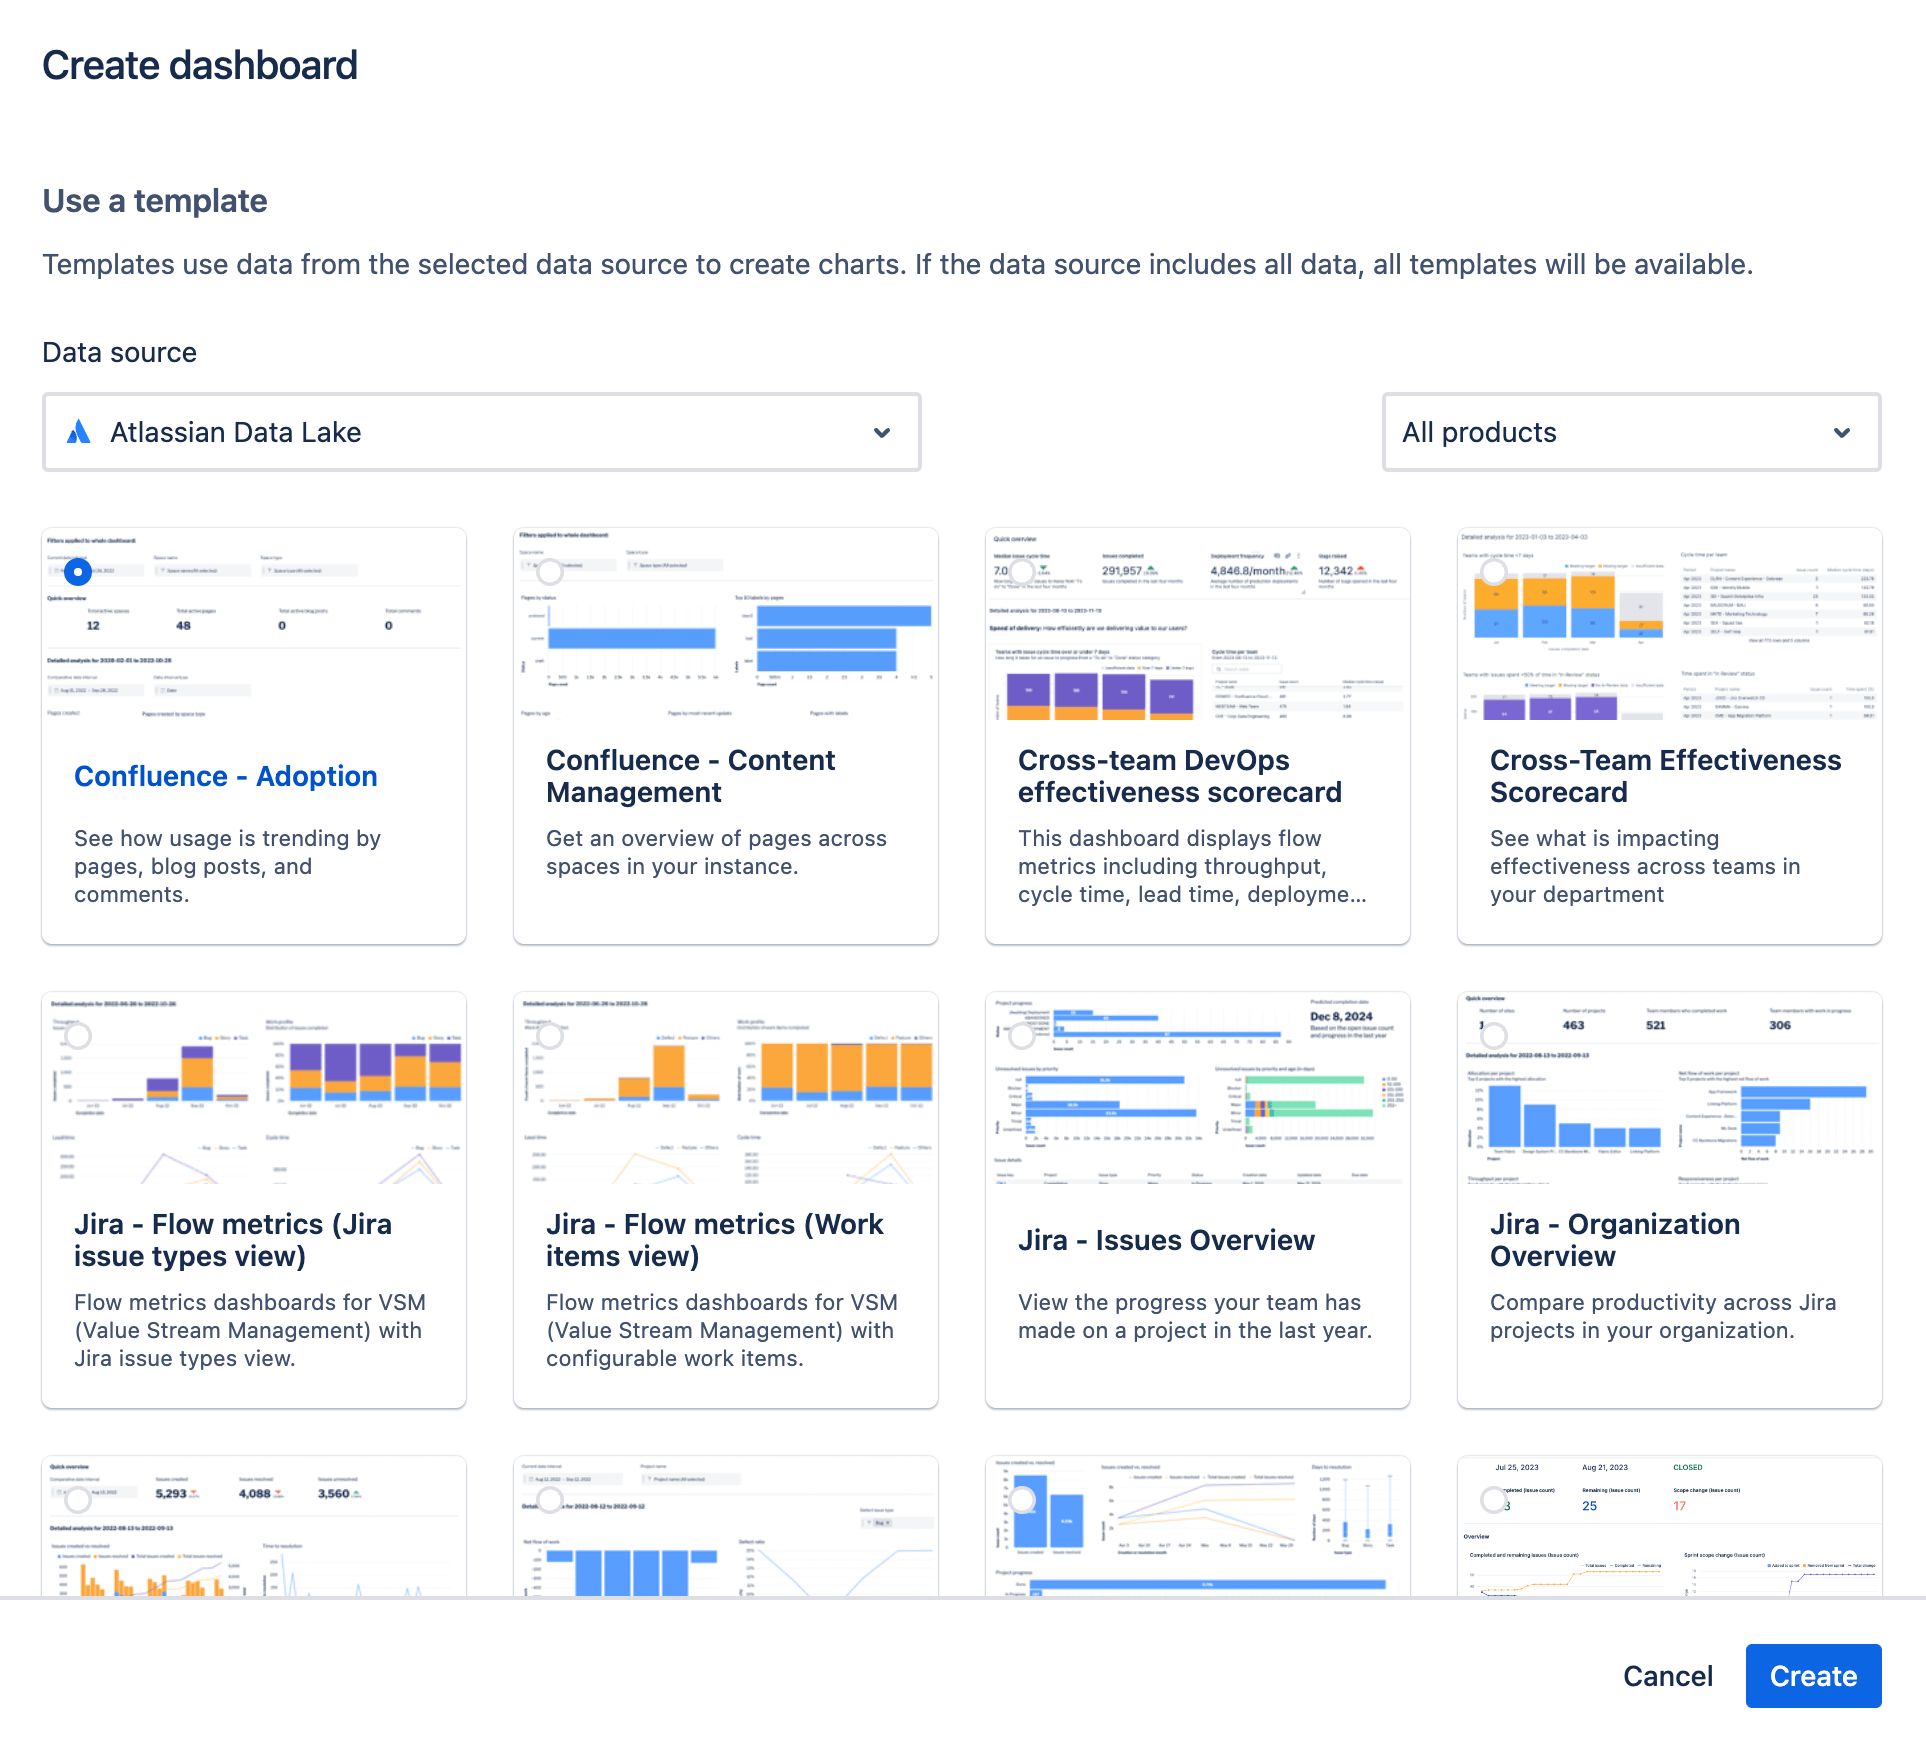
You can access a number of template dashboards and charts as soon as you create a connection to one of your product instances. These templates are designed to address the common needs of business and technical teams.
- Drill down to get insights on specific project timelines and bottlenecks
- Comment and share with key stakeholders to drive action
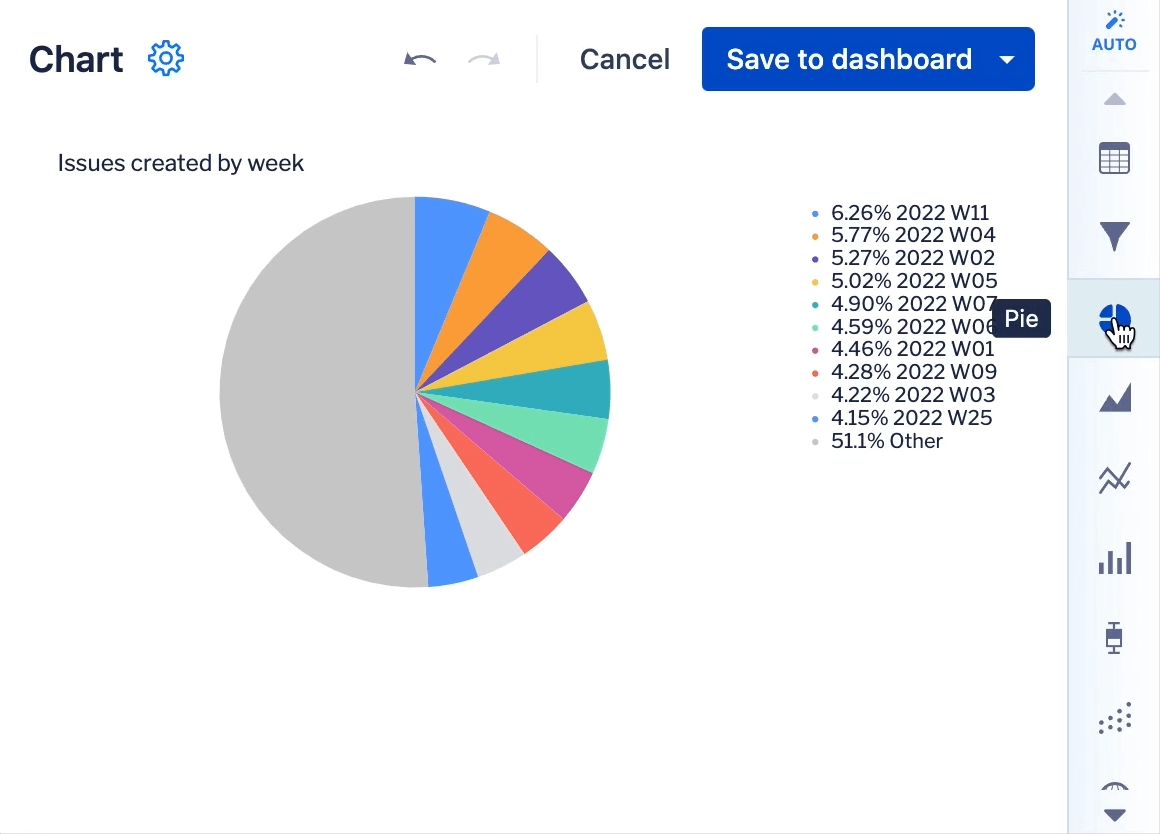
Explore multiple visualization options
Choose charts and diagrams that work best for your visualization needs. Atlassian Analytics will recommend a chart type based on the shape of your queried and transformed data. Besides, you can also build custom views across products or instances with the ability to run SQL queries. Users who may not be familiar with SQL can use visual query mode - a no-code way to build custom charts and dashboards.
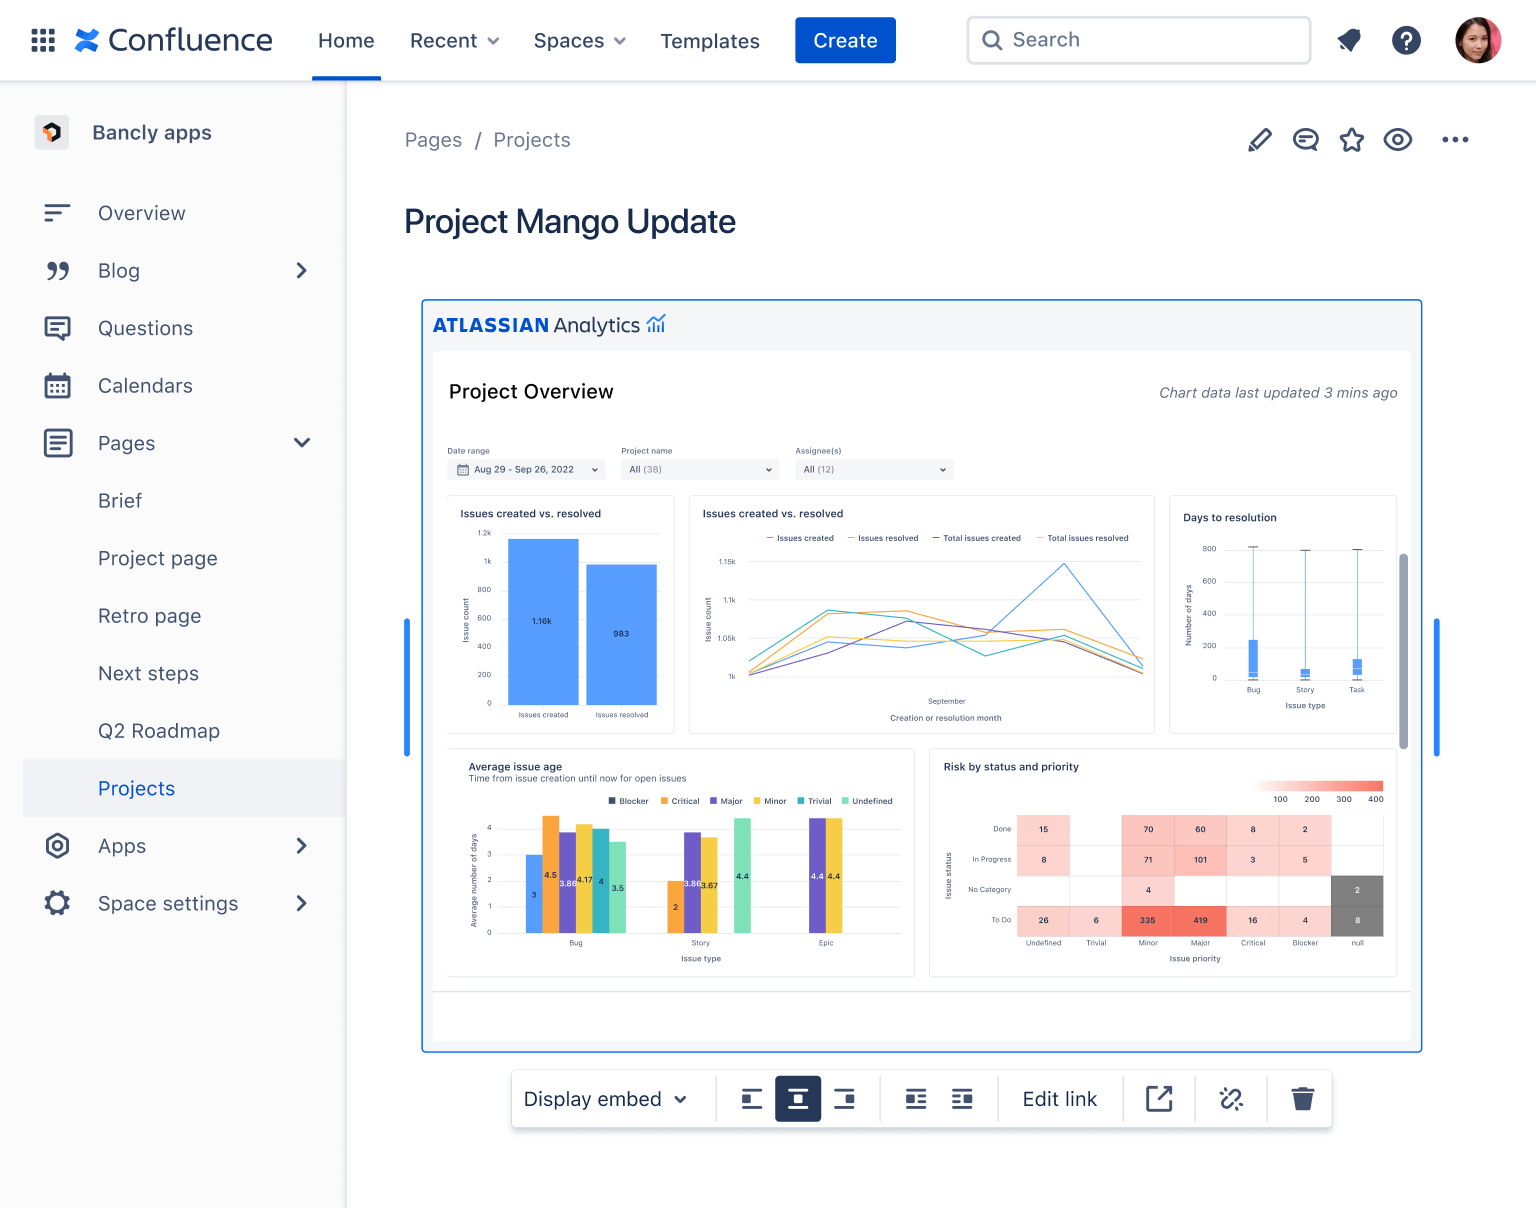
Comment, download, and embed
Atlassian Analytics dashboards and charts are collaborative by nature. Users can comment on charts and tag their team with questions. Dashboards and charts can also be shared using Smart Links into Confluence pages and Jira issues to share analysis with even more teams.
Use Atlassian Analytics for:

Reports & Dashboards
Reporting helps to analyze and track your work throughout a project. Atlassian Jira offers many different reports to show information about your issues, sprints, project, versions and epics. You can ...
Reports & Dashboards

Project Management
Atlassian tools can be used for all business processes. Modernize your project management and support a new quality for your projects.
Project Management

IT Service Management
ITSM is at the heart of enterprise modernization. With the increasing availability of software-enabled services, IT service teams can deliver value faster to employees and teams across the enterprise.
IT Service Management

Asset Management
STAGIL Asset Management: Manage all your assets: from laptops to lawnmowers
Asset Management
.svg)
DevOps
DevOps is a set of practices that works to automate and integrate your processes between software development and IT teams, so they can build, test, and release software faster and more reliably.
DevOps

Enterprise Service Management
ESM helps companies define their services and offer them in a consistent manner through a single portal that is accessible 24/7.
Enterprise Service Management
Our Services:

Consulting
We are happy to advise you in detail and personally regarding the Atlassian products and our services around Atlassian.

Configuration
Talk to our experienced consultants who analyze potential and agree with an optimization plan.
Support
No matter if you are new to the Atlassian Suite or just need a hand with a certain topic – we are glad to help.
.svg)
Development
Do you need special functions that are not covered by any existing app? We develop your own apps individually adapted to your needs.

Hosting
We are helping you to reach the availability that you need by offering several different service level categories with up to 99.9% availability.

Trainings
Teams of up to 8 can schedule private sessions, either online, or we’ll come to your site and deliver Team (Onsite) classes.

Licenses
We offer attractive package benefits and advise on advantageous options for buying or extending Atlassian licenses.

Optimization
We stabilize your atlassian systems and make sure they always run perfectly!

Atlassian Enterprise Platinum Solution Partner
Solution Partners provide the services, implementation, consulting, and unique solutions that help our users create what's next.
Our experts hold the following certificates and accolades:

.png?width=64&height=64&name=ITIL%20Foundation%20(2).png)


Your contact person:

Competences:
Atlassian Licenses, App Licenses, Consulting