Reporting and Dashboards
Turn raw data into actionable insights for smarter project management.
Get started!Benefits of Reporting Solutions from catworkx
Why Reports and Dashboards Matter
catworkx Reports and Dashboards provide a comprehensive solution for data analysis and visualizing information across Atlassian tools, including Jira reporting, Confluence dashboards, as well as marketplace apps and BI platforms. This integration consolidates fragmented reports into a single, unified view, supporting project management decisions and strategic initiatives — from daily operations to executive strategy.
Centralized Dashboards | Advanced Reporting Tools | Flexible Data Integration | Support for Agile Frameworks
For Data Analysts
Stop wasting time reconciling data from multiple tools. Integrated dashboards provide accurate, real-time metrics from Jira, Confluence, eazyBI, STAGIL, and BI platforms — so you spend more time on data analysis and less time chasing numbers. Identify trends, SLA breaches, or portfolio risks instantly, supporting better project management decisions.
For Platform Owners
Guarantee a single source of truth across Jira, Confluence, eazyBI, STAGIL, and BI tools. With governance and consistent Jira dashboards, stakeholders make decisions based on trustworthy, unified data, enabling more efficient project management.
What you can't measure, you can't control
– Peter F. Drucker

Turn Data Into Actionable Insights Across Your Organization
catworkx Reports and Dashboards empower organizations to transform Jira and Confluence data into actionable insights, supporting data analysis, informed decision-making, and continuous improvement in project management.
Tools We Use for Powerful Reporting & Dashboards
-
EazyBi
-
Atlassian Analytics
-
PowerBI Connector
EazyBi
EazyBi

|
EazyBI for JiraEazyBI transforms Jira and Confluence data into customizable reports, charts, and dashboards. It allows data analysts to dig deep into metrics and trends while giving Platform Owners confidence in consistent reporting. With automated refreshes and drill-down capabilities, EazyBI turns raw data into actionable insights — scaling from sprint-level details to executive KPIs. More about eazyBi |
Atlassian Analytics
Atlassian Analytics
|
Atlassian AnalyticsAtlassian Analytics delivers unified, AI-powered reporting across Jira, Confluence, and other Atlassian products. Built on the Atlassian Data Lake and Teamwork Graph, it provides a single, reliable source of truth for organization-wide insights. More about Atlassian Analytics |
PowerBI Connector
PowerBI Connector

|
PowerBI Connector for JiraThe PowerBI Connector for Jira provides an endpoint for PowerBI and other 3rd Party BI Tools providing an easy to setup and administer ODBC data source for the Jira data. The tool provides the desired data tables, directly usable for creating semantic models, with minimal configuration and no complex data extraction processes. More about PowerBI Connector for Jira |
STAGIL Suite for Reports & Dashboards
The STAGIL suite by catworkx enhances Jira and Confluence with powerful, flexible, and role-specific reporting capabilities. Benefit from a comprehensive set of apps – including STAGIL Assets, STAGIL Tables, and STAGIL Timetracker – to build richer, cross-functional dashboards.
STAGIL apps enable deeper data insights, automated reporting, and scalable visualization across projects and departments. Managers can easily access actionable metrics, while executives receive consolidated, organization-wide overviews. The STAGIL suite brings consistency, efficiency, and smarter decision-making – without manual overhead.
STAGIL Assets (Advanced links management & Data model)
Atlassian Jira
Jira Align

Power BI Connector for Jira
sumUp for Jira

Atlassian Analytics
Timetracker

ITSM Reports - Charts, Graphs, and Dashboard Gadgets for JSM

Exalate Connector for Jira, Issue Sync & Two-way Integration
Table Grid Next Generation

Timepiece - Time in Status for Jira

Activity Timeline: Resource Capacity Planning, Time Tracking
Where Reports & Dashboards Add Value
Insightful Dashboards for Every Business Area
From ITSM to executive strategy, catworkx Reporting & Dashboards unify data across teams, tools, and processes, enabling informed decisions based on metrics and project management insights.
.svg) Operational Reporting
Operational Reporting
Track daily workload, SLA compliance, and backlog size inside Jira dashboards. Teams gain instant clarity on current operations and can leverage data analysis for project management.
 Executive Dashboards
Provide leadership with cross-departmental KPIs, OKR progress, and finance/operations correlations — condensed into a single source of truth.
 Business Intelligence Integration
Combine Atlassian data with external BI tools (like Power BI and Grafana) for richer visualizations, trend analysis, and deeper context around KPIs.
 Project & Portfolio Dashboards
Gain visibility across multiple projects, track dependencies, and delivery timelines. Ensure project portfolio management decisions are based on real-time, consolidated data.
 Custom Visualizations
Adapt dashboards to roles and departments. Service managers track SLA breaches, executives monitor strategic KPIs, and teams follow operational workflows — all in custom Jira dashboards.
 Data Quality Monitoring
Ensure leadership decisions are based on accurate and reliable data. Monitor data quality across teams and tools to prevent gaps, inconsistencies, and outdated information from impacting KPIs and strategic reporting.
IT Service Management
SLA monitoring dashboards for proactive workload balancing.
Project Portfolio Management
Resource allocation and delivery health across initiatives.
DevOps & Engineering
Deployment frequency, lead time, and incident resolution dashboards.
Business Performance Monitoring
Connect operational metrics to financial outcomes for strategic planning.
Cross-Departmental Visibility
Consolidate data from Jira, Confluence, and Marketplace apps to power executive decisions.


eazyBi For Jira
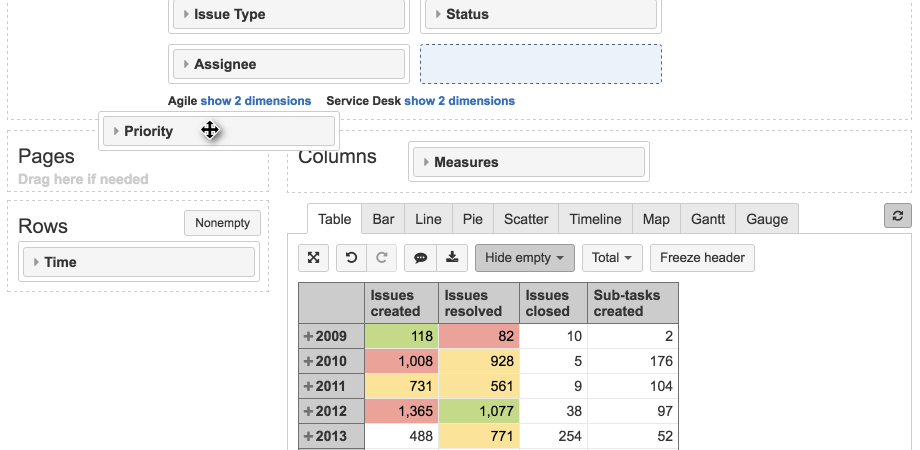
For those who need a powerful reporting tool, we recommend eazyBI for Atlassian Jira. eazyBI provides various reports, charts and dashboards in Jira that analyze and visualize your data from Jira via drag-and-drop.
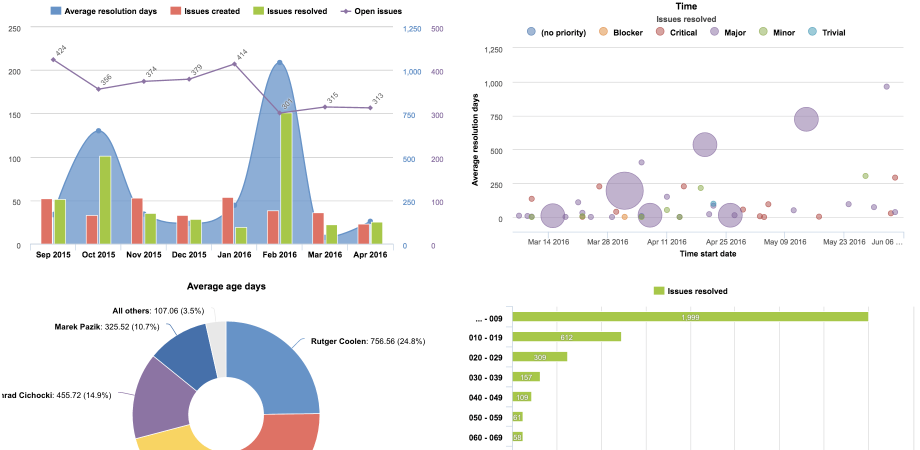
Identify top/bottom performers as well as trends and analyze standard and custom fields of your Jira operations. Starting with a general data overview, you can drill down as broadly or deeply as you like. Visualize your data in charts customized to the individual use case, create pivot table reports and implement eazyBI reports as dynamic gadgets on Jira dashboards.
eazyBI supports Jira, Jira Service Management and Tempo Timesheets Custom Fields, Xray, Zephyr and Adaptavist Test Management Data.
Additional information can also be imported from SQL and REST API data sources as well as from CSV or Excel tables and combined with Jira data in charts and reports.
STAGIL Reports for Jira by catworkx
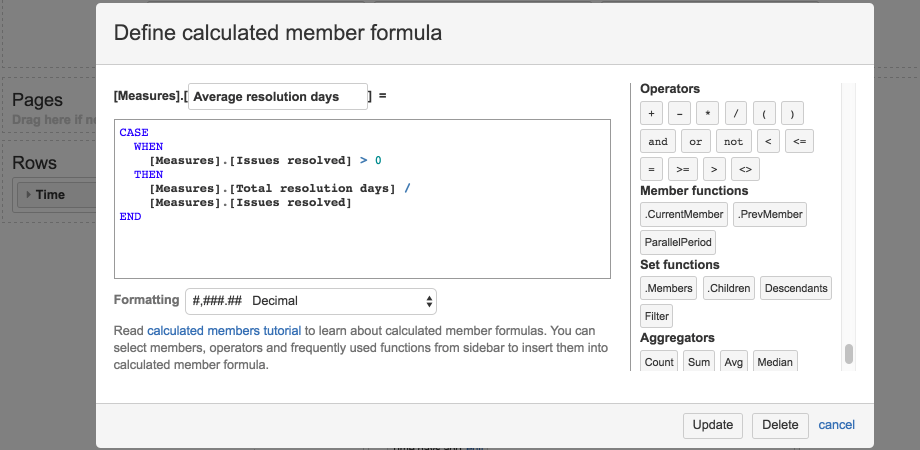
Use "catworkx Reports for Jira" to generate custom gadgets based on JQL, Calculated or Scripted Fields directly in Jira. Our app uses custom fields including scripts as well as JQL-based filters. The results can be visualized in Jira dashboards.
Why catworkx?
Technical competences
As an Atlassian Enterprise Platinum Solution Partner, we know the Atlassian tools extremely well. Therefore, we can configure your reporting systems quickly and efficiently. As an official partner of eazyBi, we have extensive experience in training and configuration of eazyBI.
Understanding the process
Measurability, reporting and controlling should play an important role when designing new processes in your company. This is the only way to determine whether your initiatives are successful. Our senior consultants help you to make internal processes in your company measurable.
Connect with Related Solutions
Why catworkx?
-
Deep Atlassian Expertise
-
Process-Driven Approach
-
Tailored Solutions
Deep Atlassian Expertise
Deep Atlassian Expertise
 Deep Atlassian Expertise
As an Atlassian Enterprise Platinum Solution Partner, we know the Atlassian ecosystem inside out. This allows us to configure reporting systems quickly and efficiently. Our partnership with eazyBI adds extensive experience in both configuration and training, ensuring your teams get maximum value from their analytics tools.
Process-Driven Approach
Process-Driven Approach
 Process-Driven Approach
Effective reporting starts with well-designed processes. Measurability, monitoring, and control are essential to determine the success of any initiative. Our senior consultants work closely with you to make your internal workflows transparent, measurable, and aligned with your business goals.
Tailored Solutions
Tailored Solutions
 Tailored Solutions
Every organization is unique. We customize dashboards, workflows, and reporting structures based on your specific request types and operational needs, so your teams can make data-driven decisions with confidence.


.png?width=64&height=64&name=ITIL%20Foundation%20(2).png)


