Custom Charts for Jira - Reports, Dashboards, Graphs & Tables
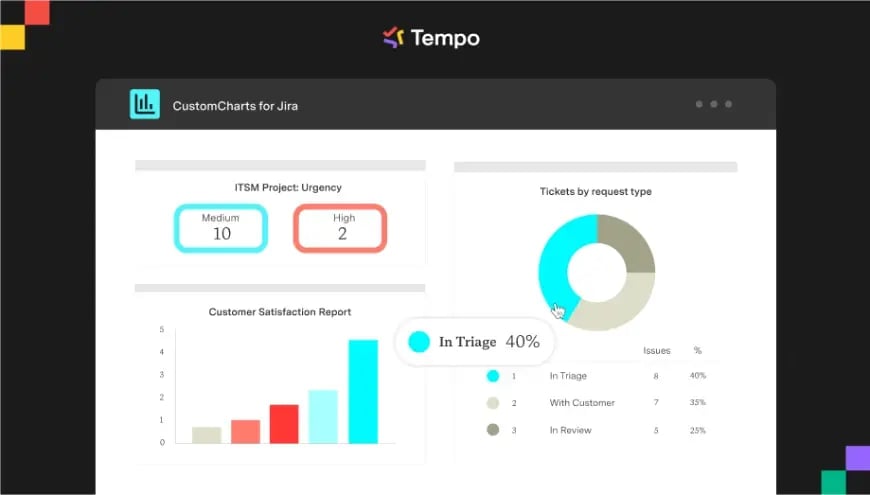
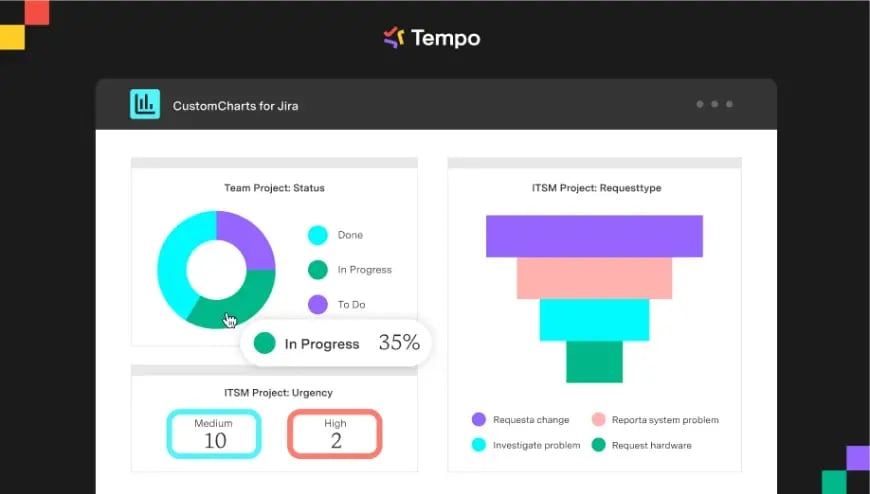
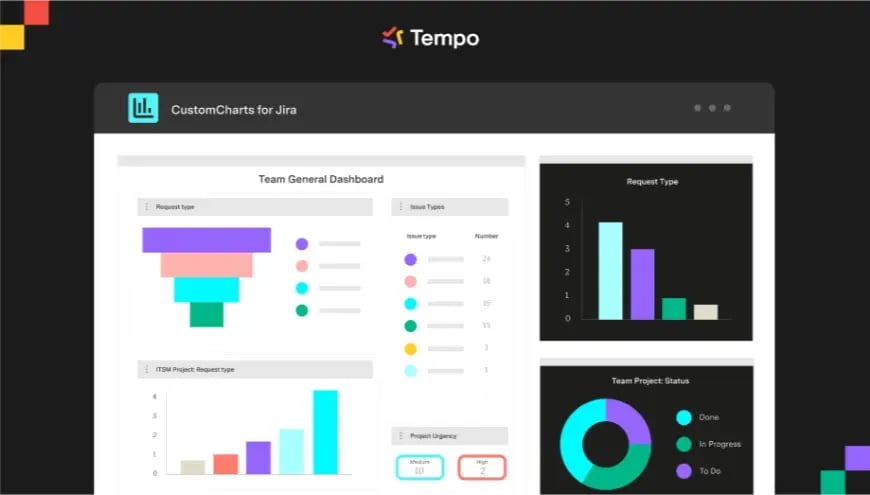
Easily create comprehensive charts, graphs, & reports for your Jira Dashboards & Analytics. Add filters, tables, search & colors
Marketplace
Customizable bar & line charts directly in Jira
Learn how to build Agile, ITSM and Business reports using simple functions like drag-n-drop, color picker and custom order.
Report on crucial metrics like Issue History, Time in Status and 3rd party apps.
Track all your Time metrics on one Jira Dashboard
Dashboard reporting lets you create charts to monitor team members’ time usage, productivity, or potential blockers. Configure time in status, burnup, & burndown reports or pull data from Tempo Timesheets.
Our Services:
Consulting
We are happy to advise you in detail and personally regarding the Atlassian products and our services around Atlassian.
Configuration
Talk to our experienced consultants who analyze potential and agree with an optimization plan.
Support
No matter if you are new to the Atlassian Suite or just need a hand with a certain topic – we are glad to help.
Development
Do you need special functions that are not covered by any existing app? We develop your own apps individually adapted to your needs.
Hosting
We are helping you to reach the availability that you need by offering several different service level categories with up to 99.9% availability.
Trainings
Teams of up to 8 can schedule private sessions, either online, or we’ll come to your site and deliver Team (Onsite) classes.
Licenses
We offer attractive package benefits and advise on advantageous options for buying or extending Atlassian licenses.
Optimization
We stabilize your atlassian systems and make sure they always run perfectly!
Your contact person:

Competences:
Atlassian Licenses, App Licenses, Consulting


.png?width=64&height=64&name=ITIL%20Foundation%20(2).png)


